Monday, July 20, 2015

WOPR: A simple markup for rich terminal reports, presentations and infographics

@YaronNaveh

I have just released WOPR. It is a markup format (xml) based on blessed-contrib that allows to decleratively define terminal reports, presentations and infographics.


You can create such XML reports, put them on the web (e.g. gist), and view them via curl:


Or if you can handle a full deck:


WOPR is useful to create build / production reports, presentations and infographics.


Check WOPR here

@YaronNaveh

What's next? get this blog rss updates or register for mail updates!

Thursday, April 30, 2015

Running Terminal Dashboards on Windows

@YaronNaveh

With blessed-contrib it is easy to create terminal dashboards using ascii-art:


blessed-contrib uses Braille fonts which are available by default on Linux and Mac distributions but not on Windows:


In order to run such dashboards on windows you need to perform the following steps:

1. Download, open and install the FreeMono font.
2. Follow these instructions in order to to configure FreeMono in the windows terminal.
3. In the command line type: "set TERM=windows-ansi".
4. Clone & Run the blessed-contrib project according the regular guidelines (or run any other dashboard that you need)

Enjoy :)

@YaronNaveh

What's next? get this blog rss updates or register for mail updates!

Wednesday, January 14, 2015

Building Terminal Dashboards Using Ascii/Ansi Art

@YaronNaveh

Developers are most productive when working at the command prompt. A lot of applications have command line utilities to facilitate that. However those cli's restrict themselves to textual based data. When it is time to show any kind of graphics, a browser or desktop applications are preferred. For me this is a huge miss of the terminal full potential. Having a native terminal way to create graphics would allow developers keeping the same aesthetics across the board, rather than switching back and forth to the browser experience. It would also open opportunities for better ssh experience and utilities. And as it is always available a command line away, it also provides a better experience for any quick visualization we require (think dashboards, monitoring etc.)

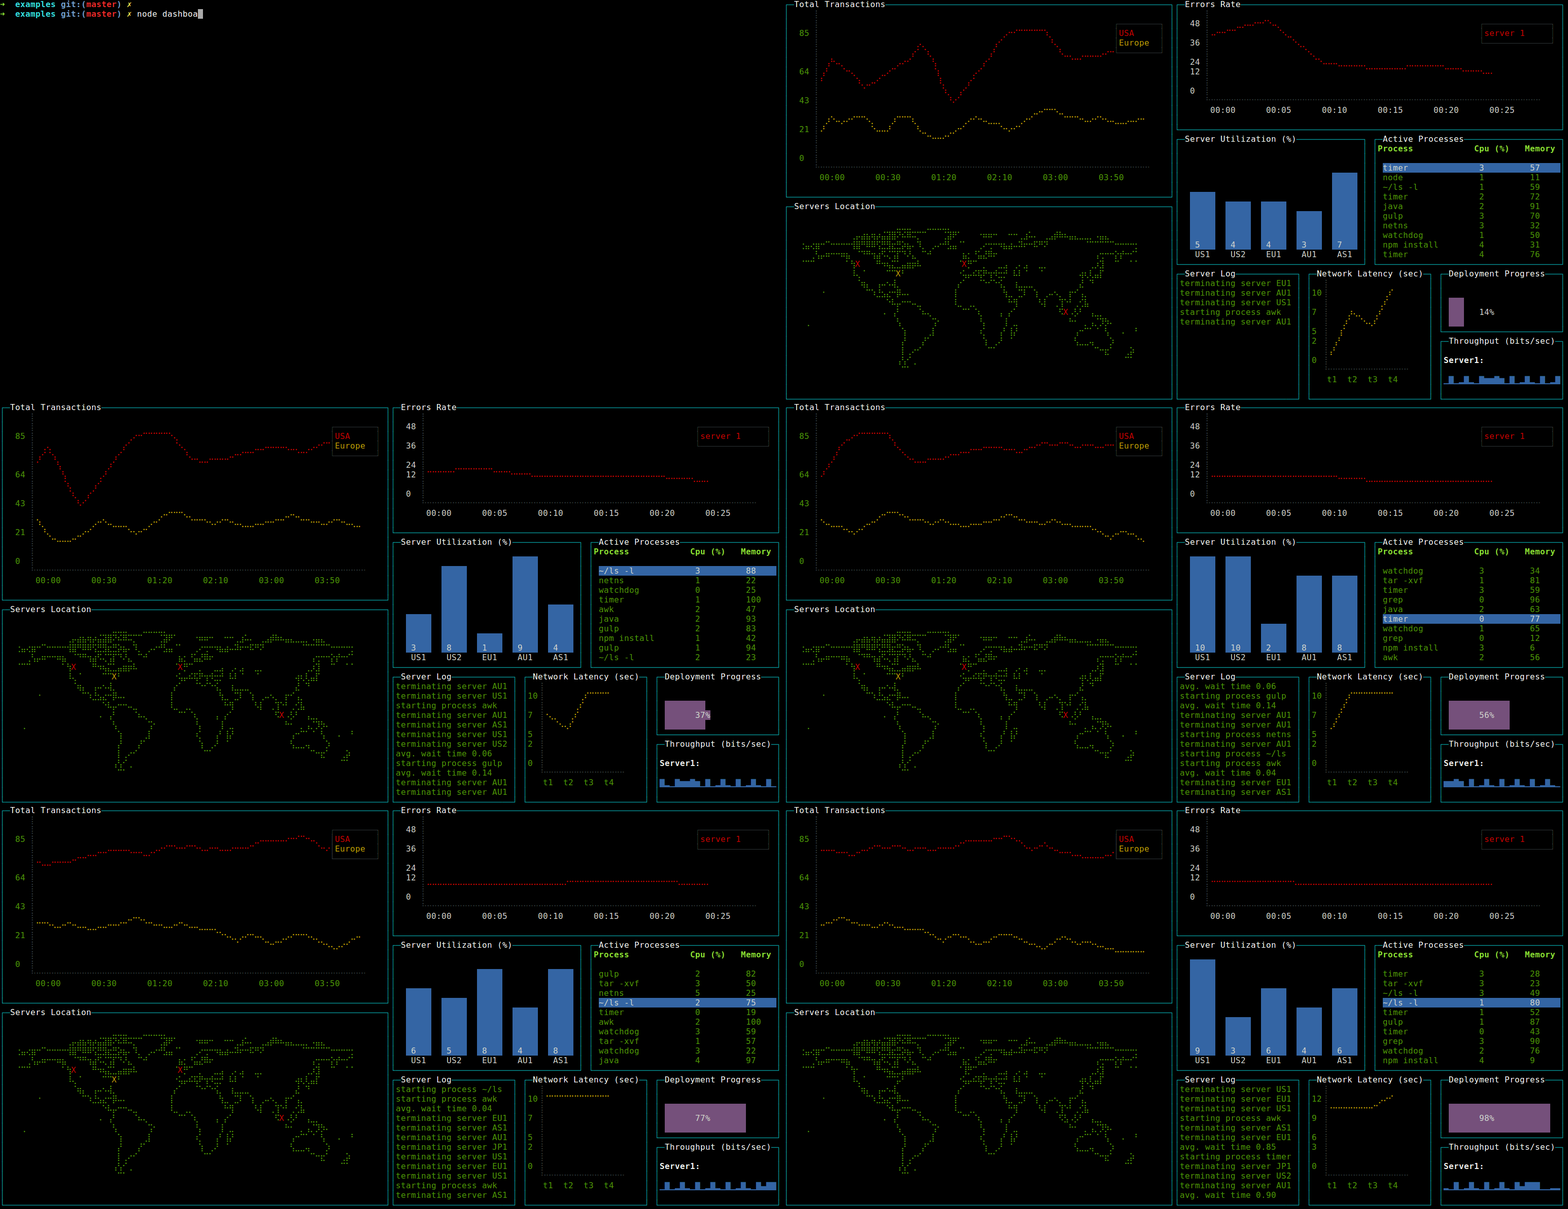


This is why I have built a Node.JS library to build dashboards using ascii/ansi art. I am using blessed, which is an NCurses-like javascript library, and drawille, which provides an HTML5 canvas abstraction over the terminal. The full details are in the github repository.

Check it out on github.

@YaronNaveh

What's next? get this blog rss updates or register for mail updates!